Organization Dashboard
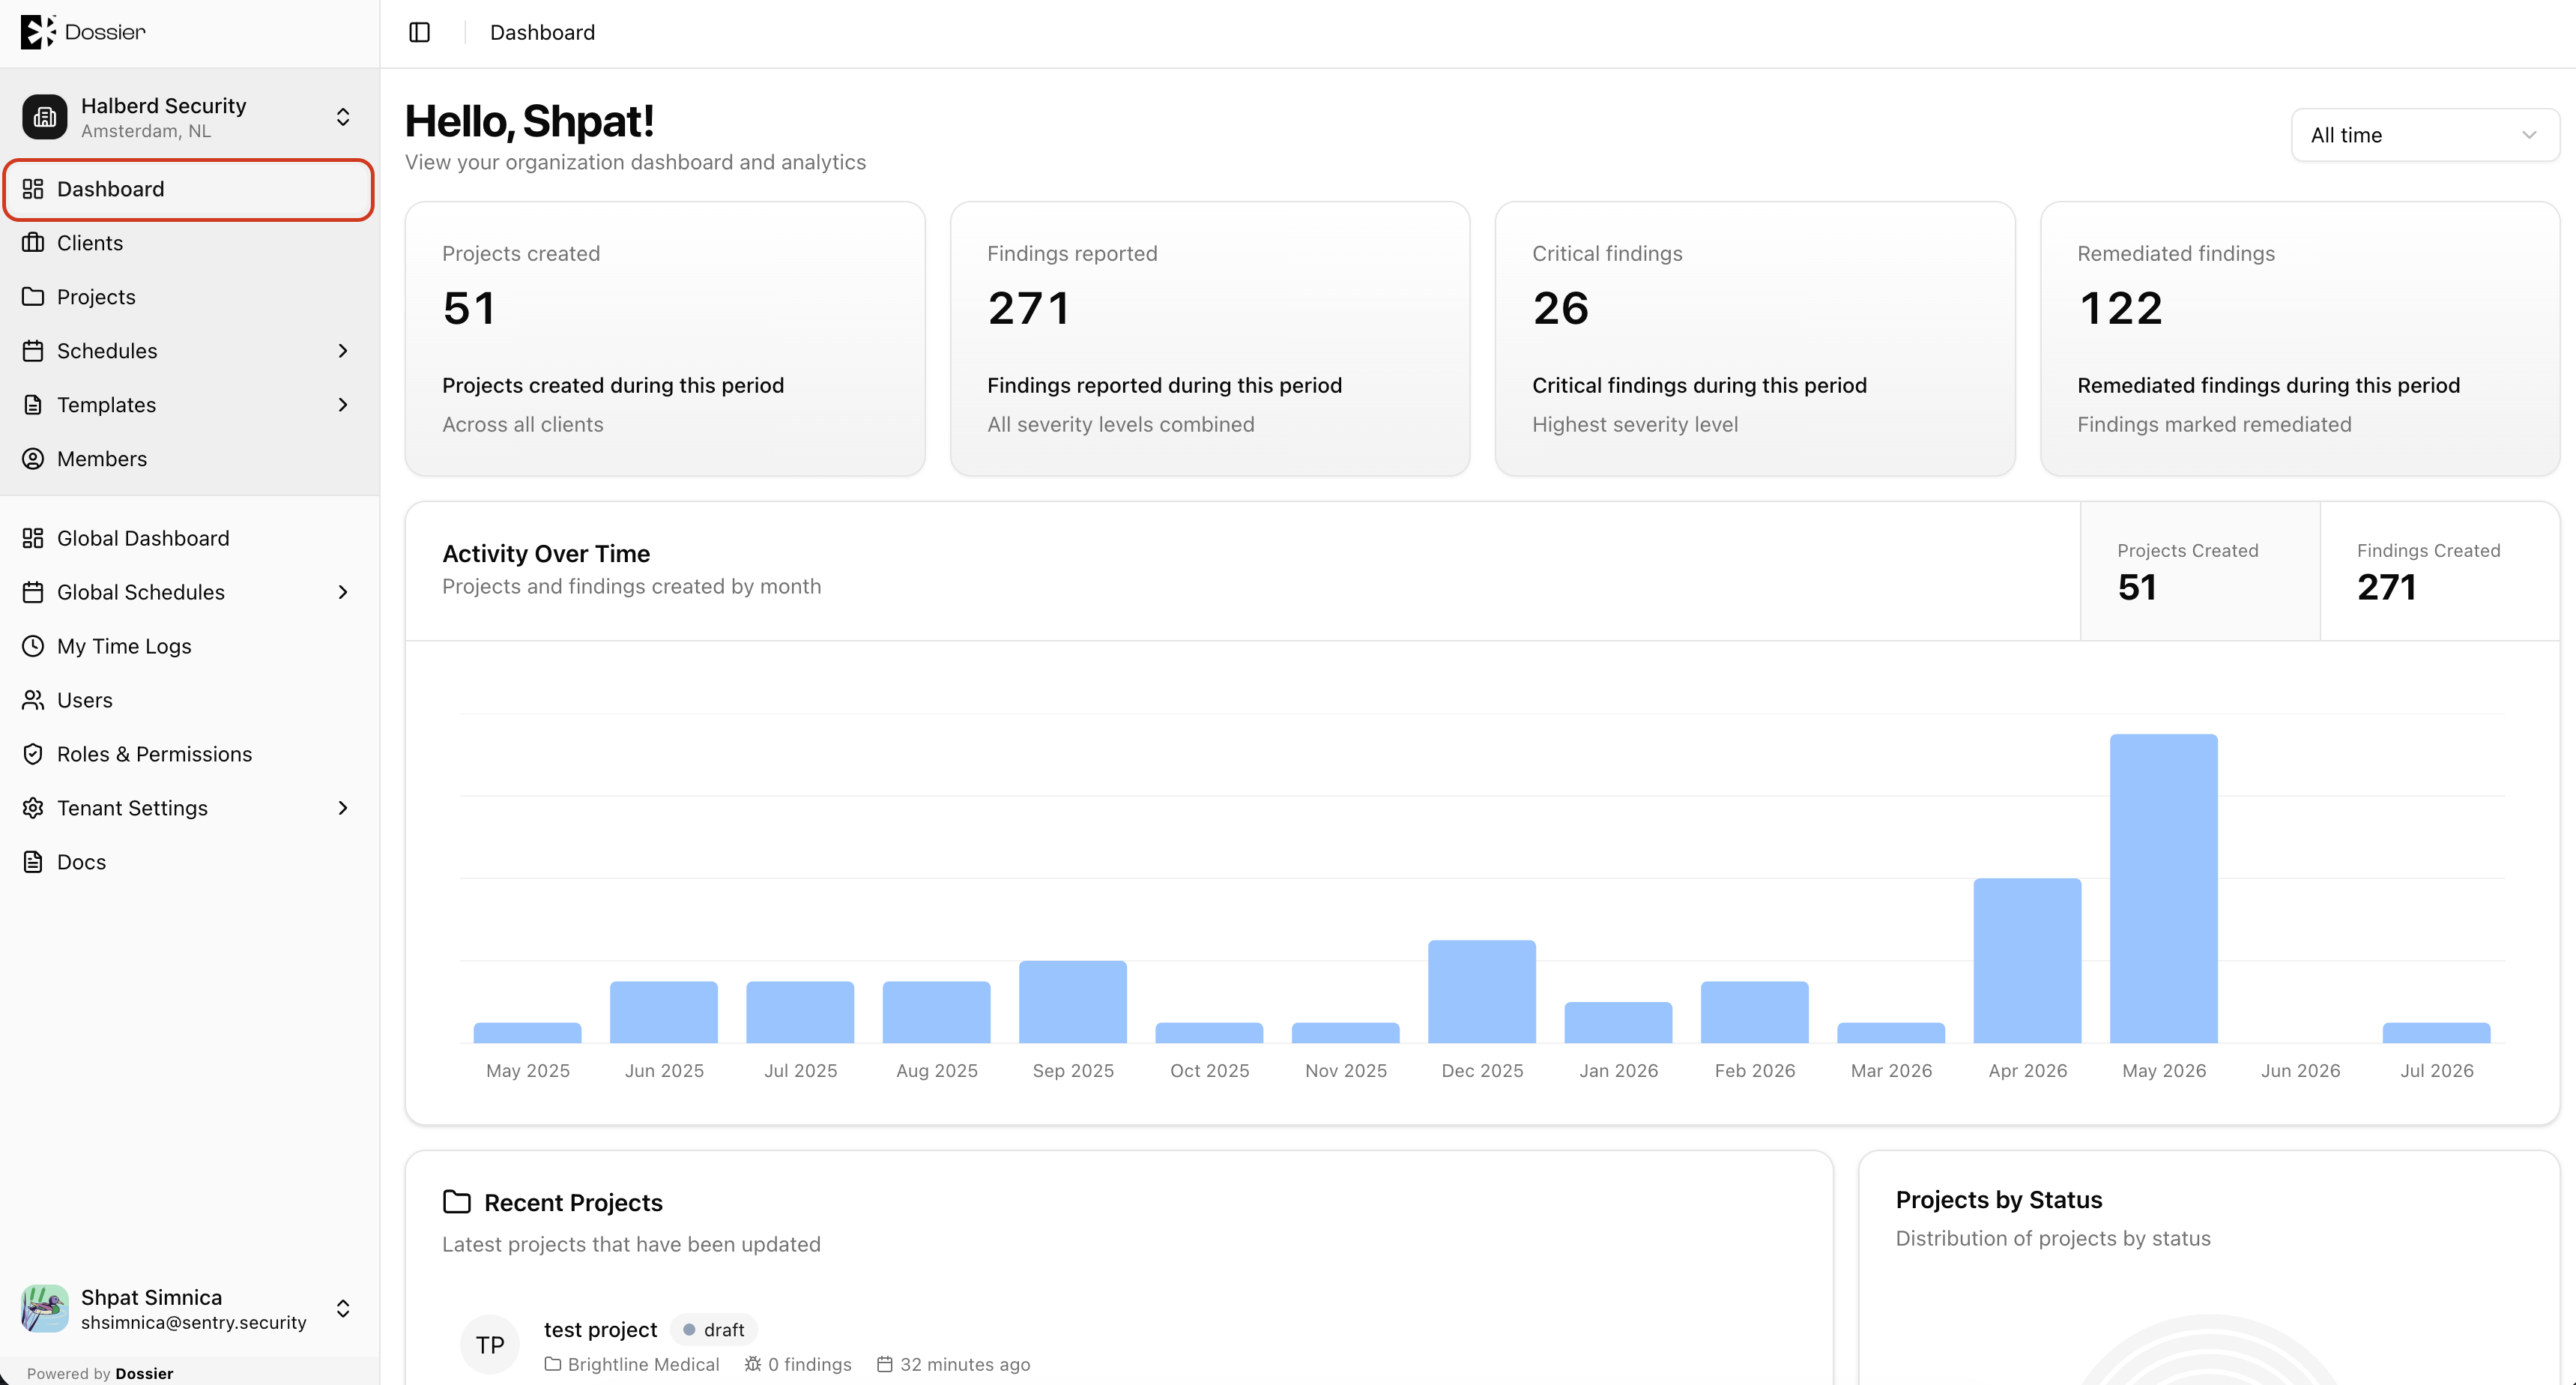
The organization dashboard is the default landing page after you select an organization. It gives you a snapshot of all activity within that org.
Accessing the Dashboard
- Select an organization from the sidebar org switcher.
- Click Dashboard in the sidebar, or navigate to
/org/:organizationId/dashboard.
Using the Date Range Filter
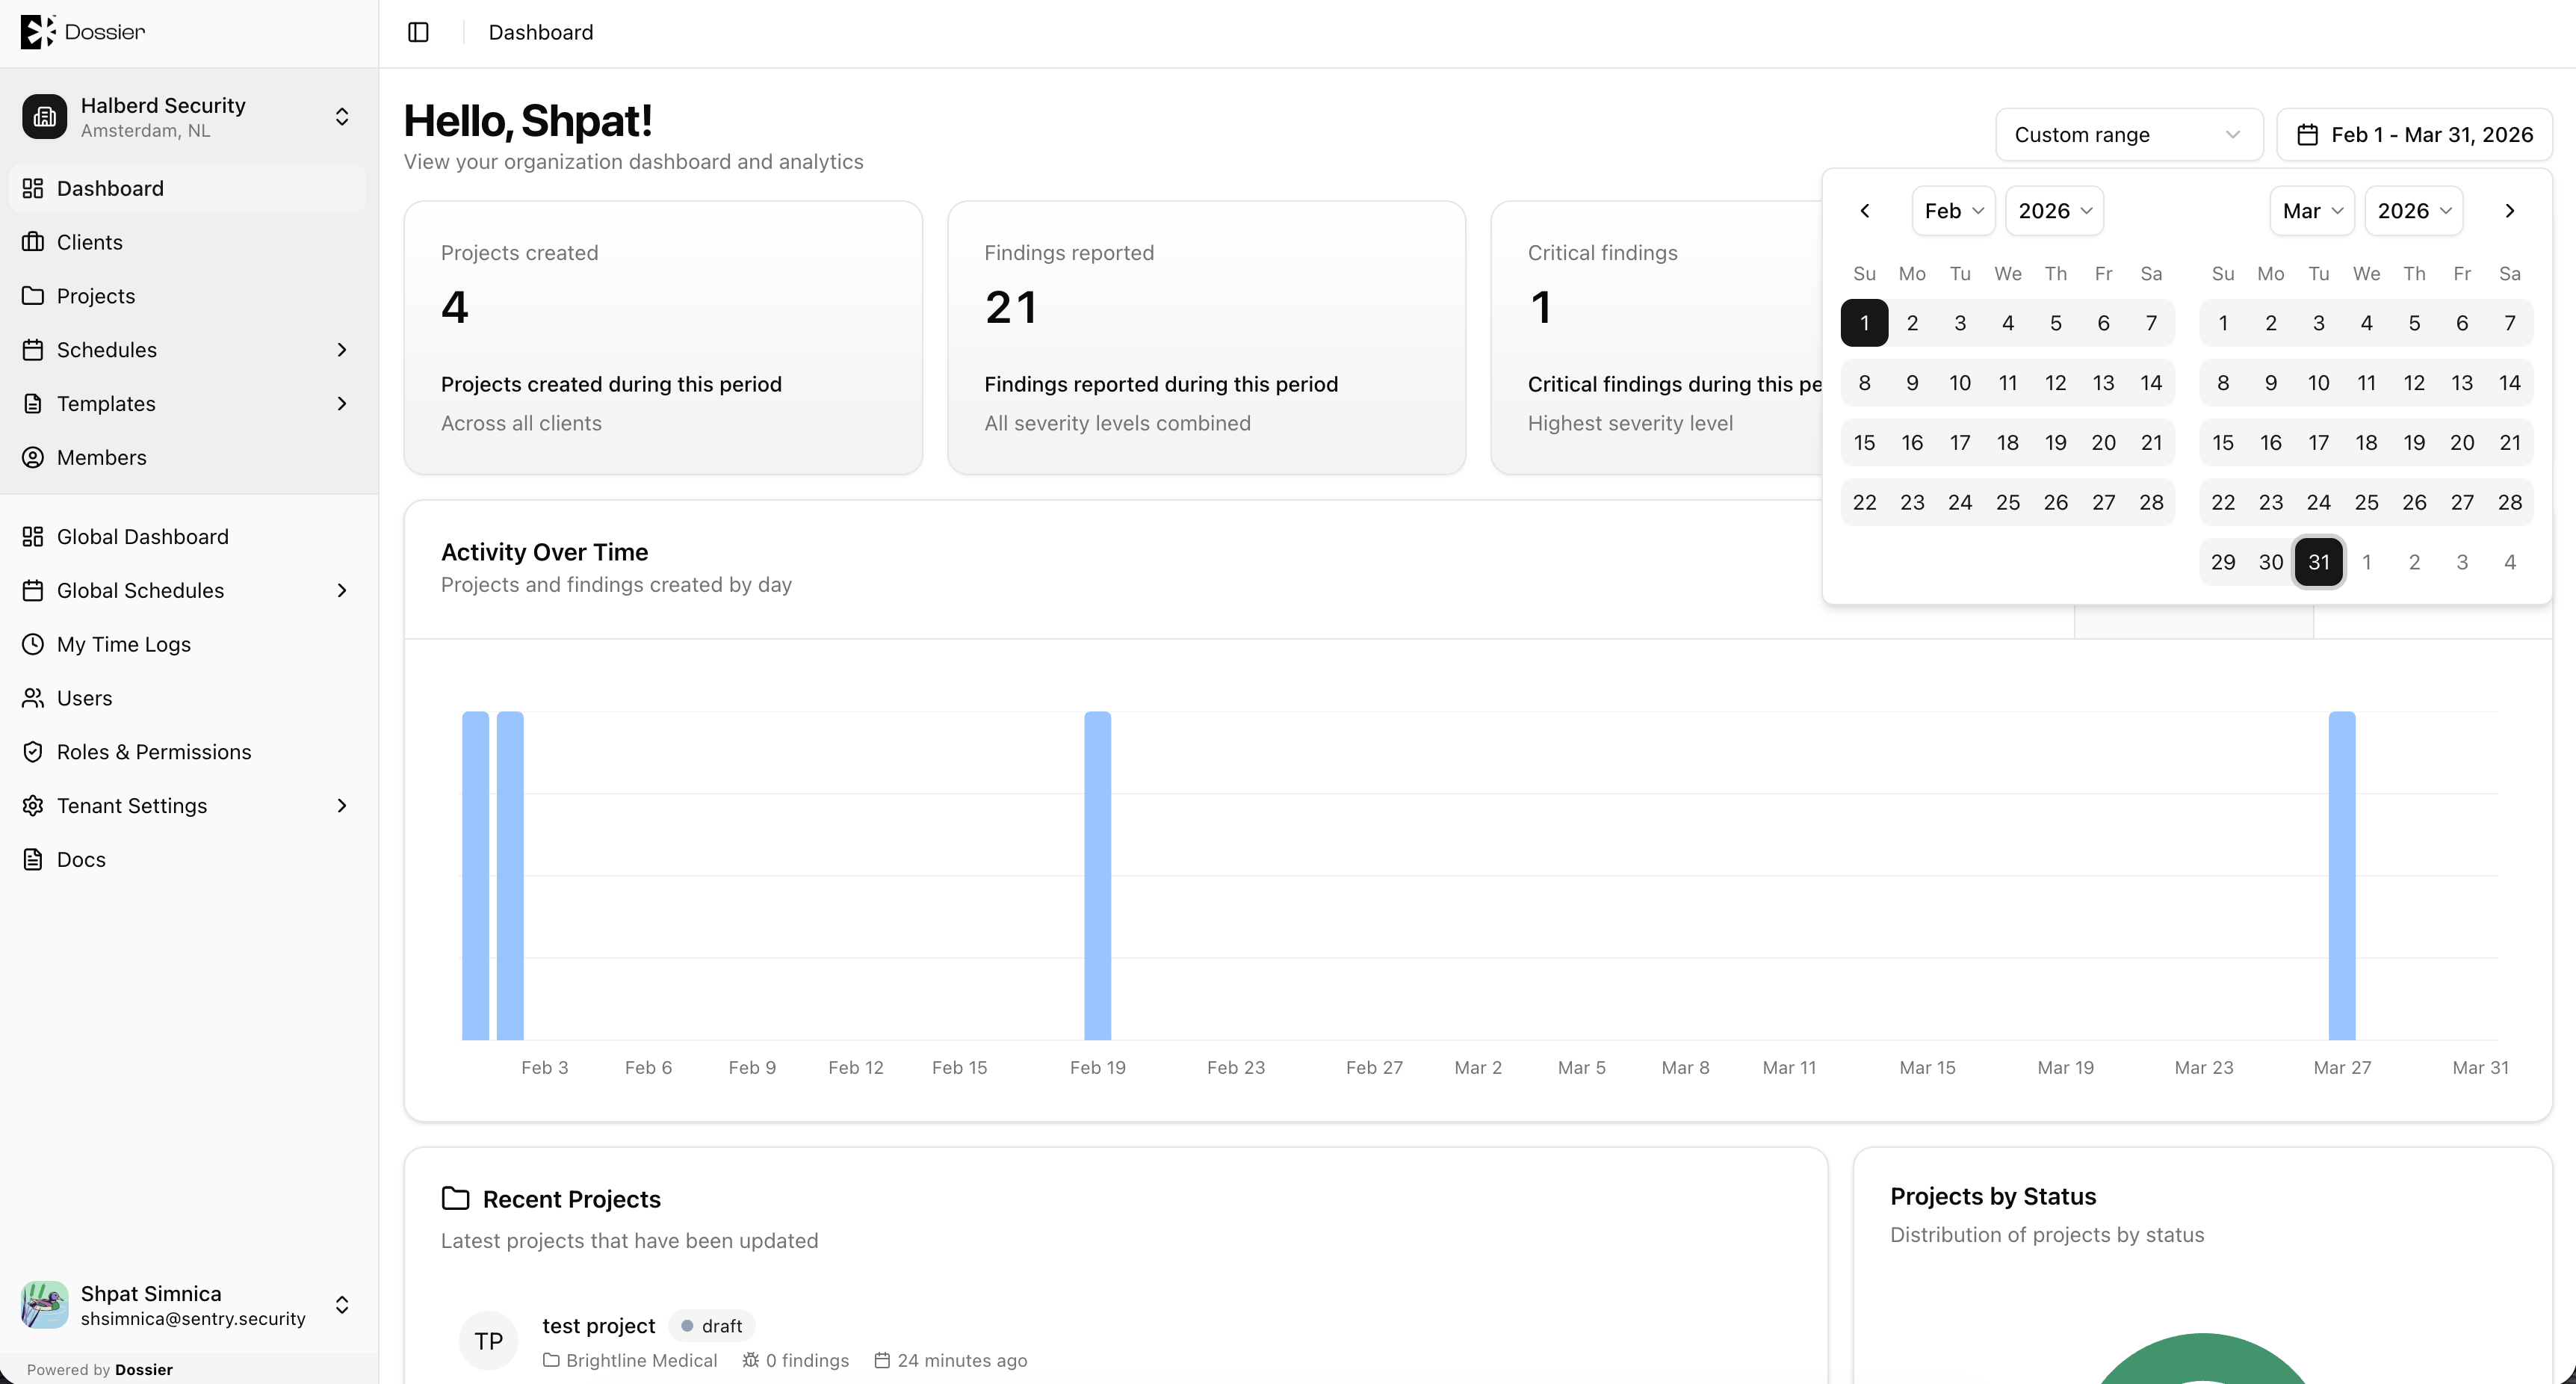
At the top of the dashboard, use the date range picker to filter charts and summary cards to a specific period.
Summary Cards
The top row displays counts for:
- Projects — Total projects in the organization, with status breakdown.
- Findings — Total findings across all projects.
- Assets — Total assets across all projects.
Click a card to navigate to the relevant list page.
Recent Activity Chart
The activity bar chart shows events (status changes, new findings, comments) over the selected date range. Hover over bars to see counts for each day.
Recent Projects and Findings
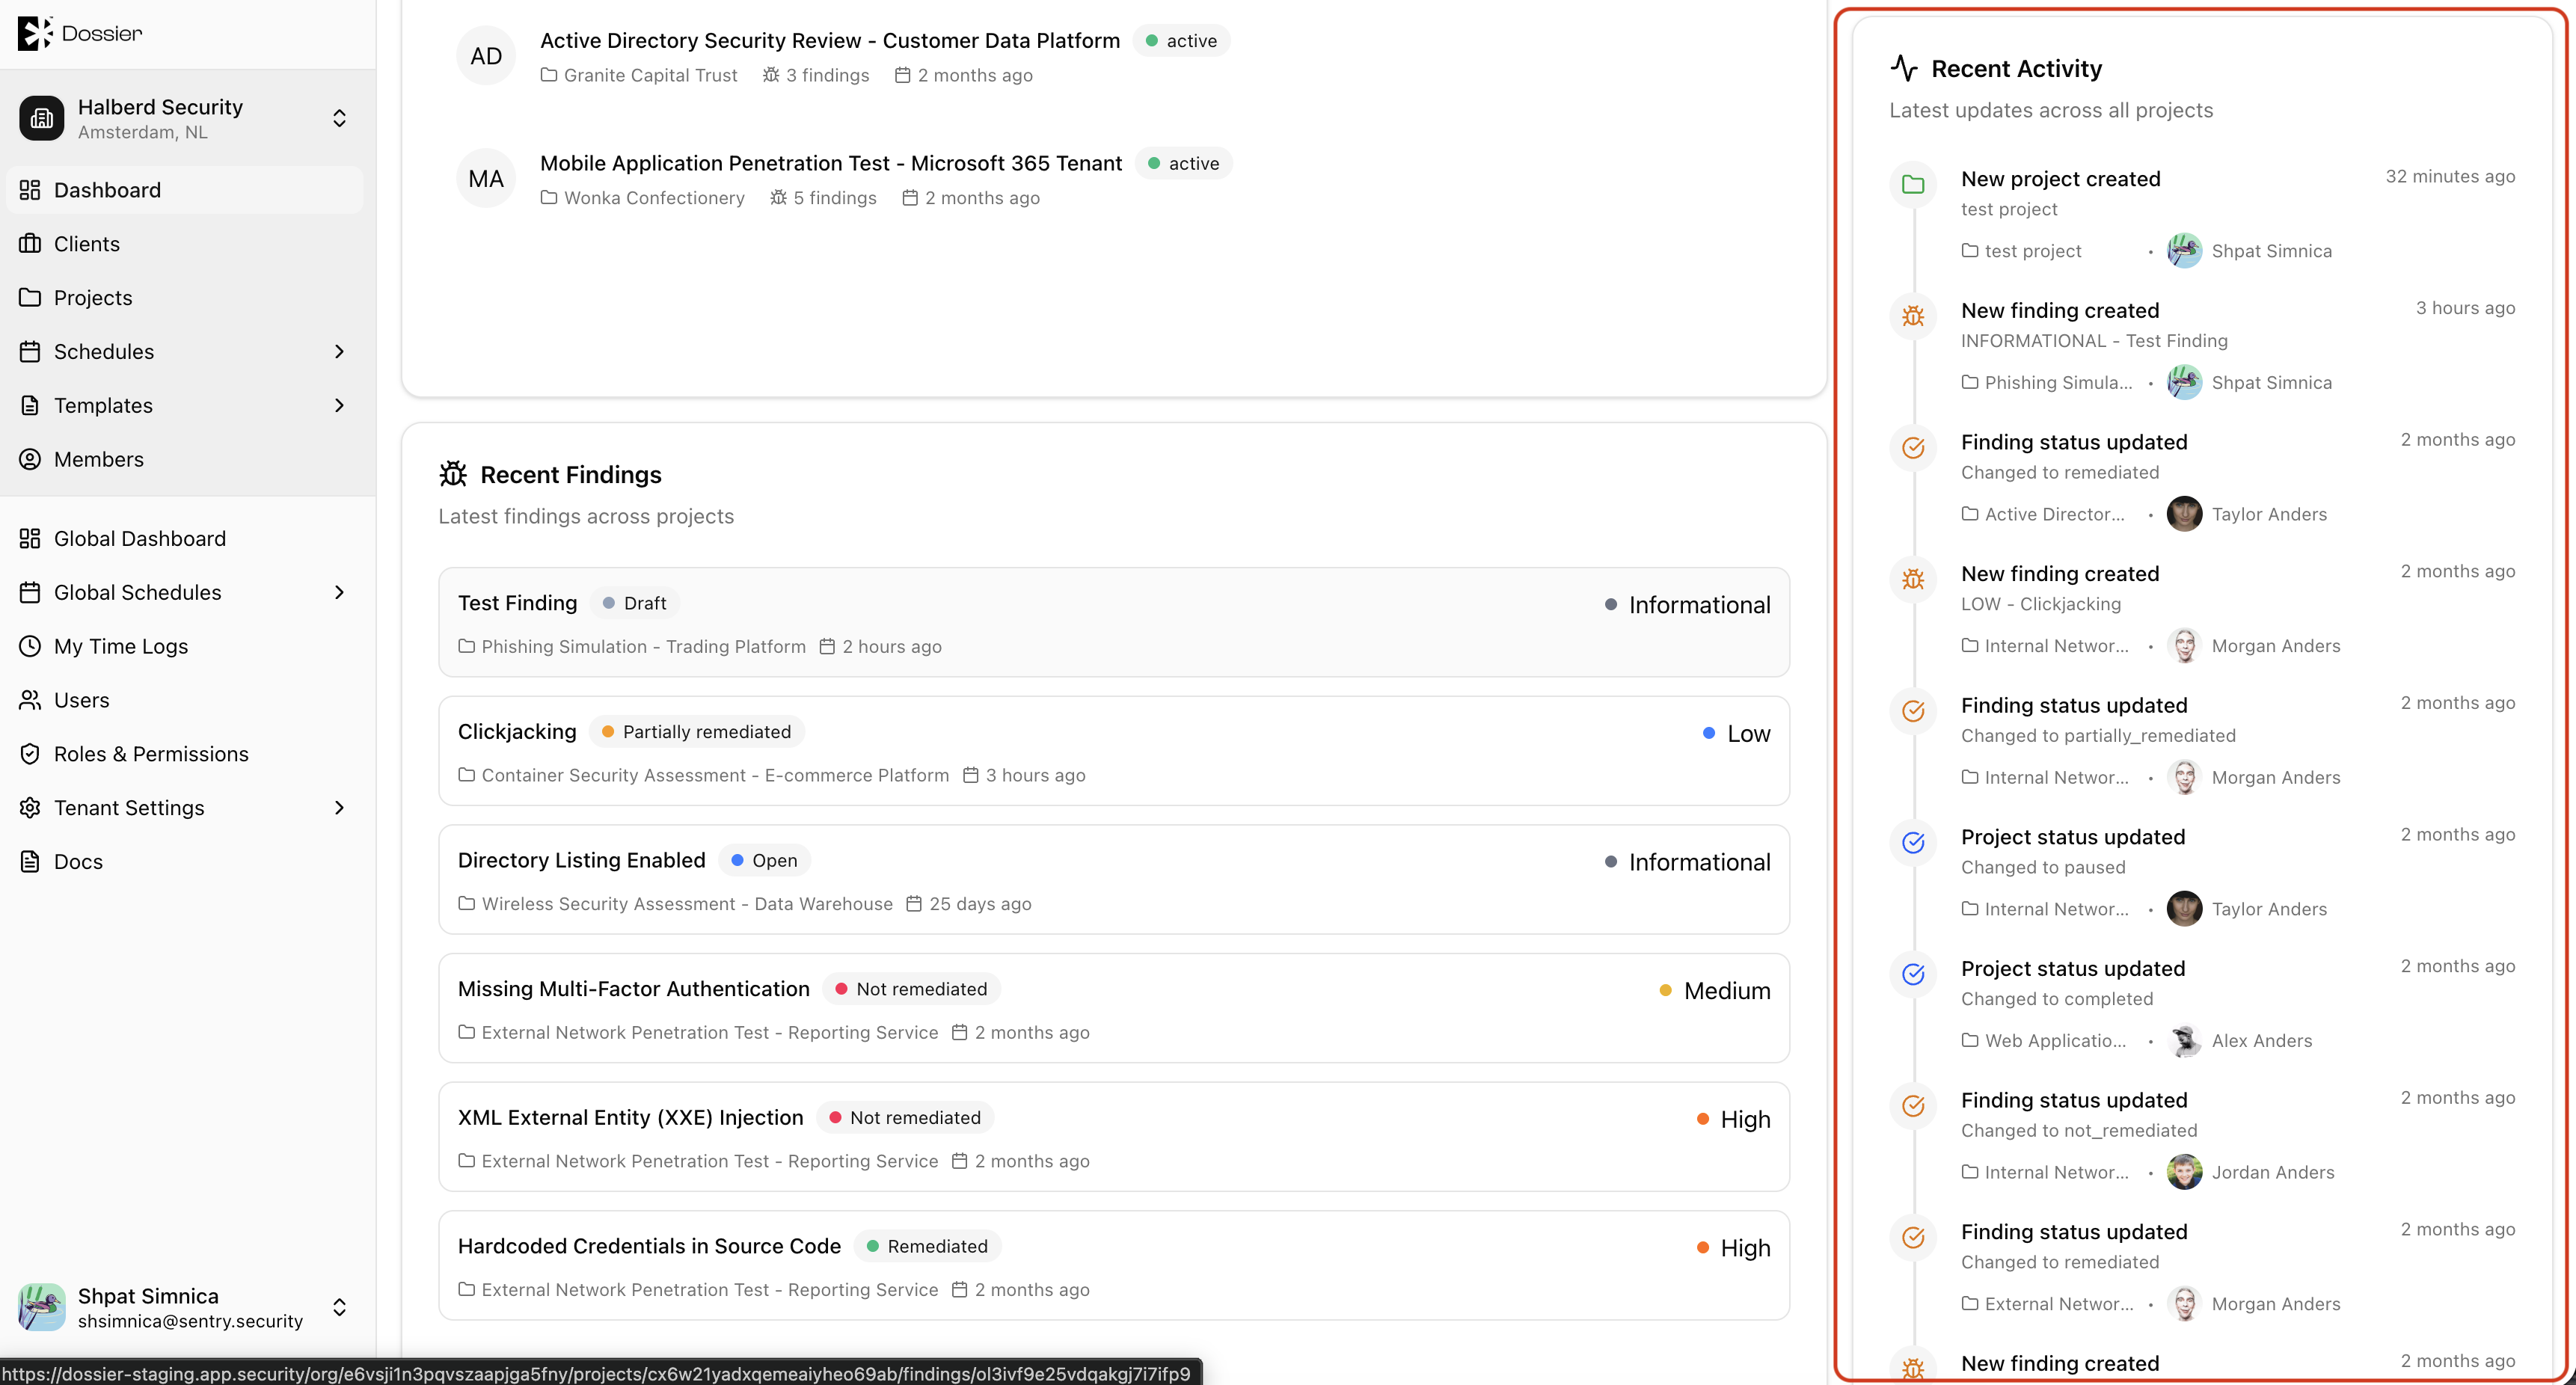
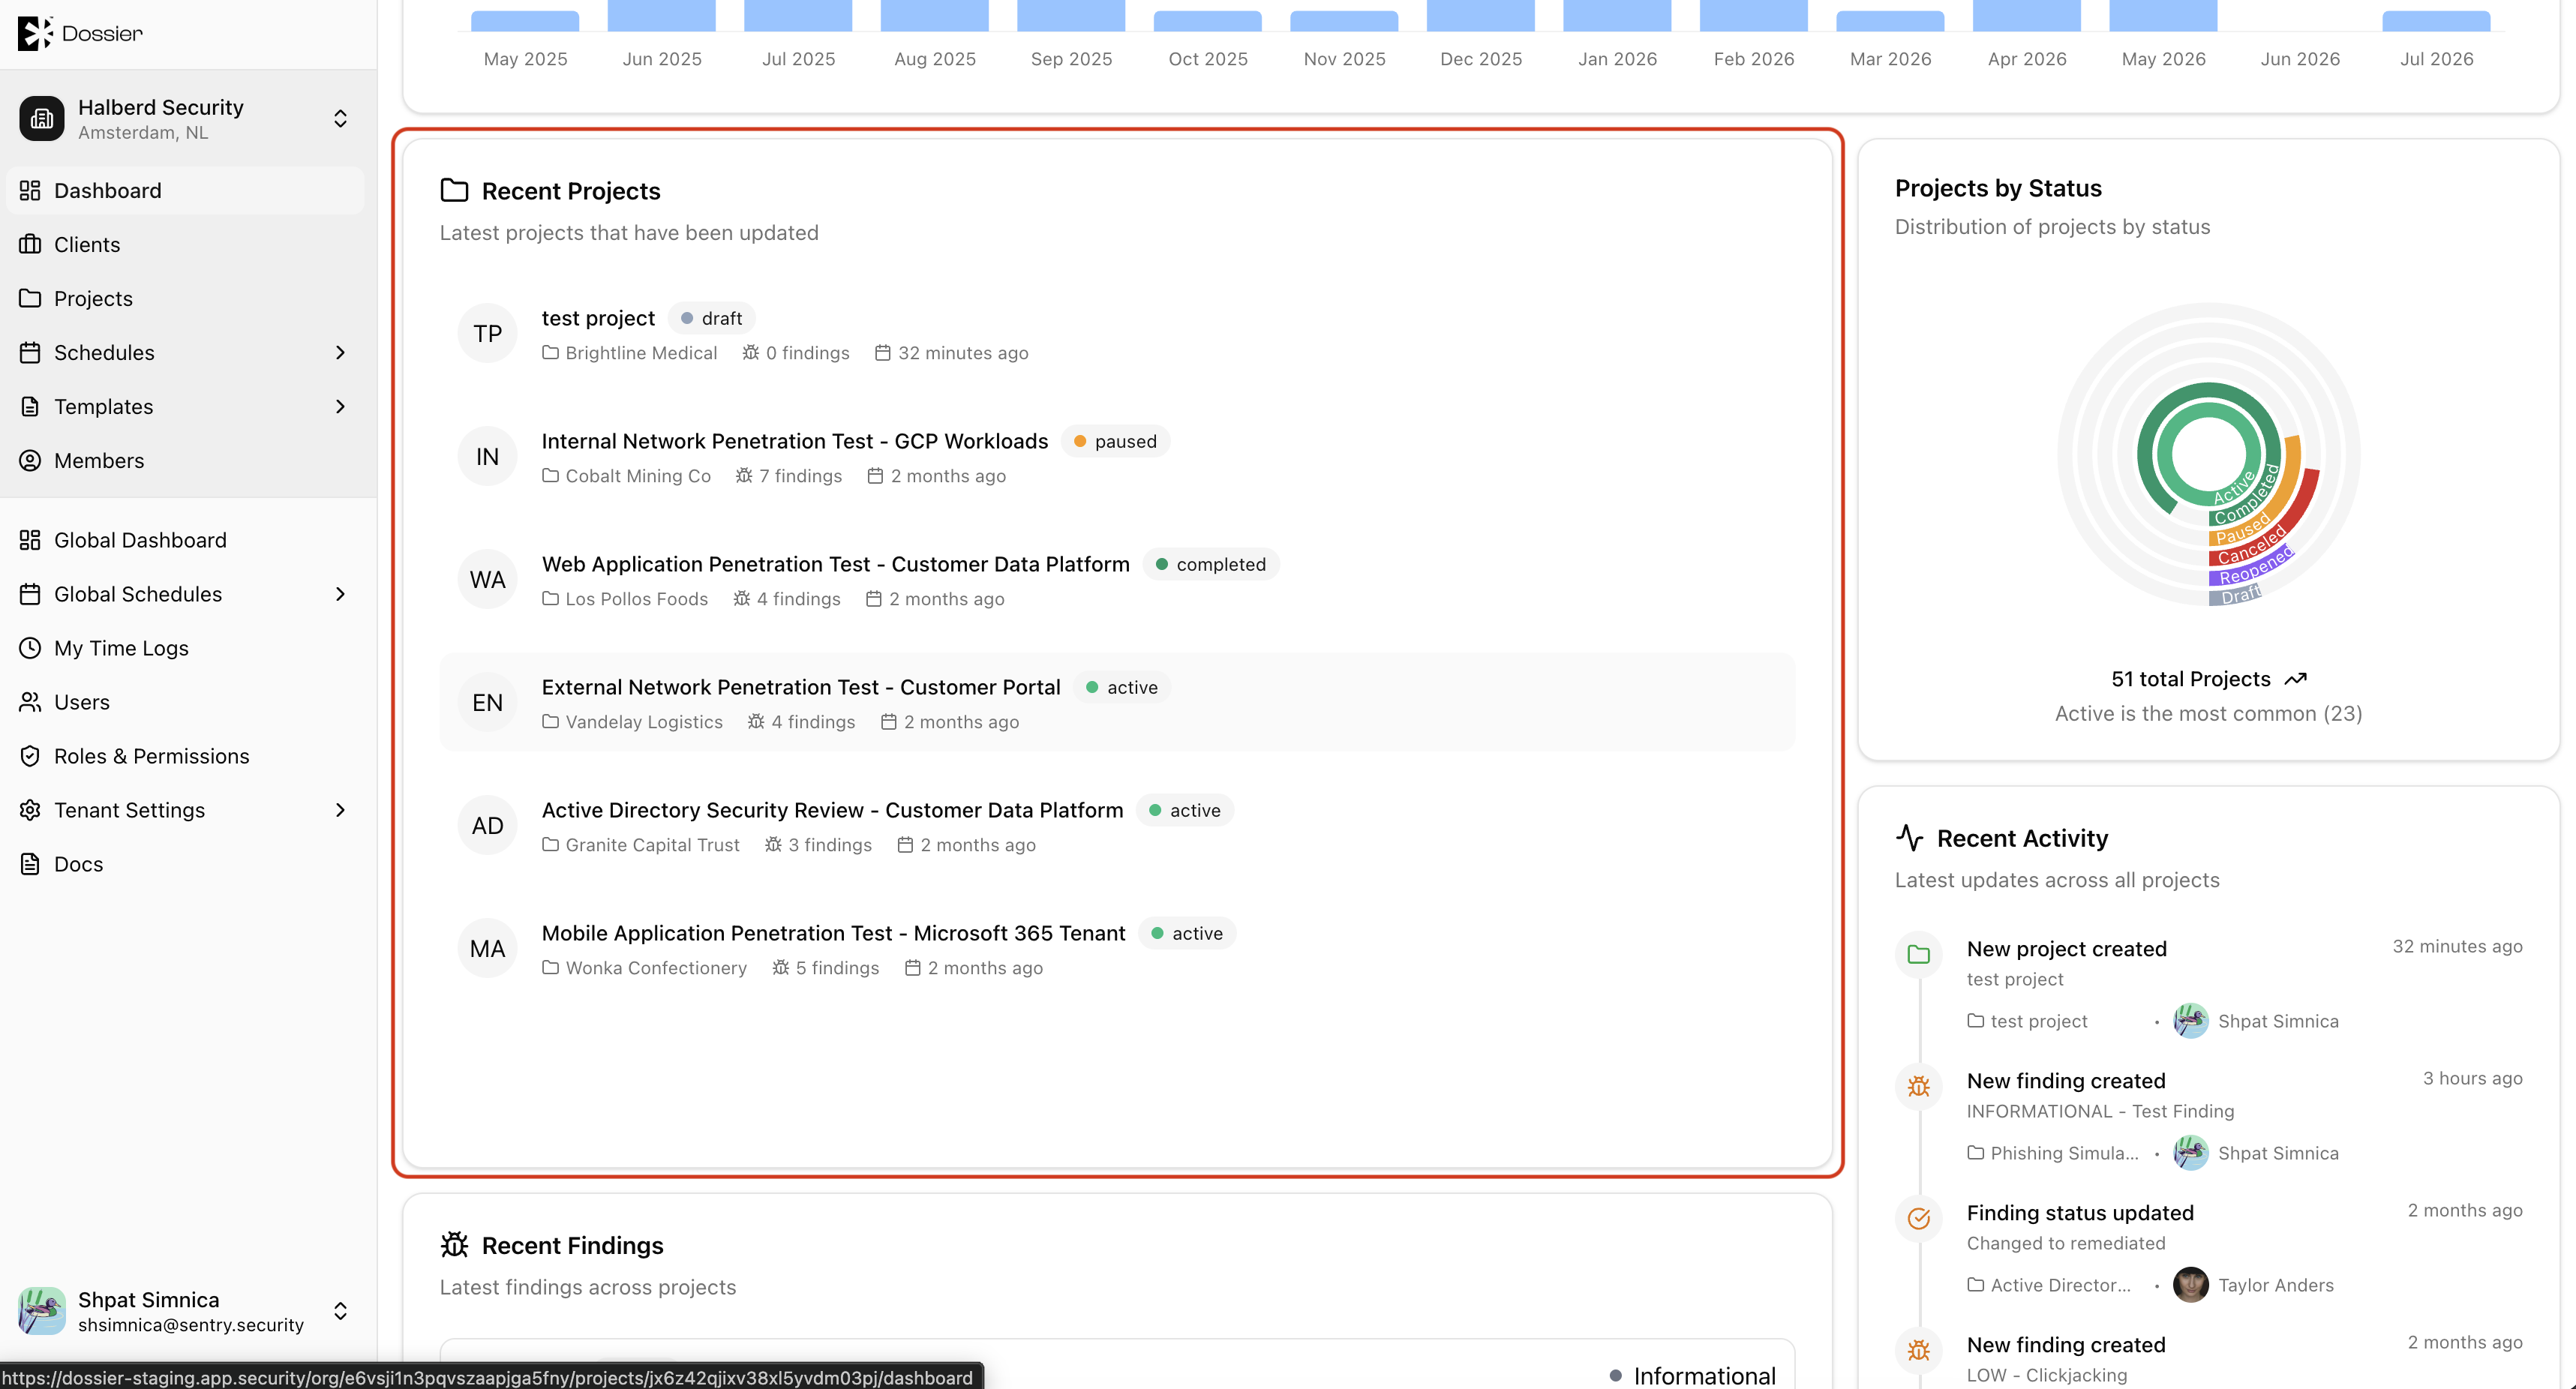
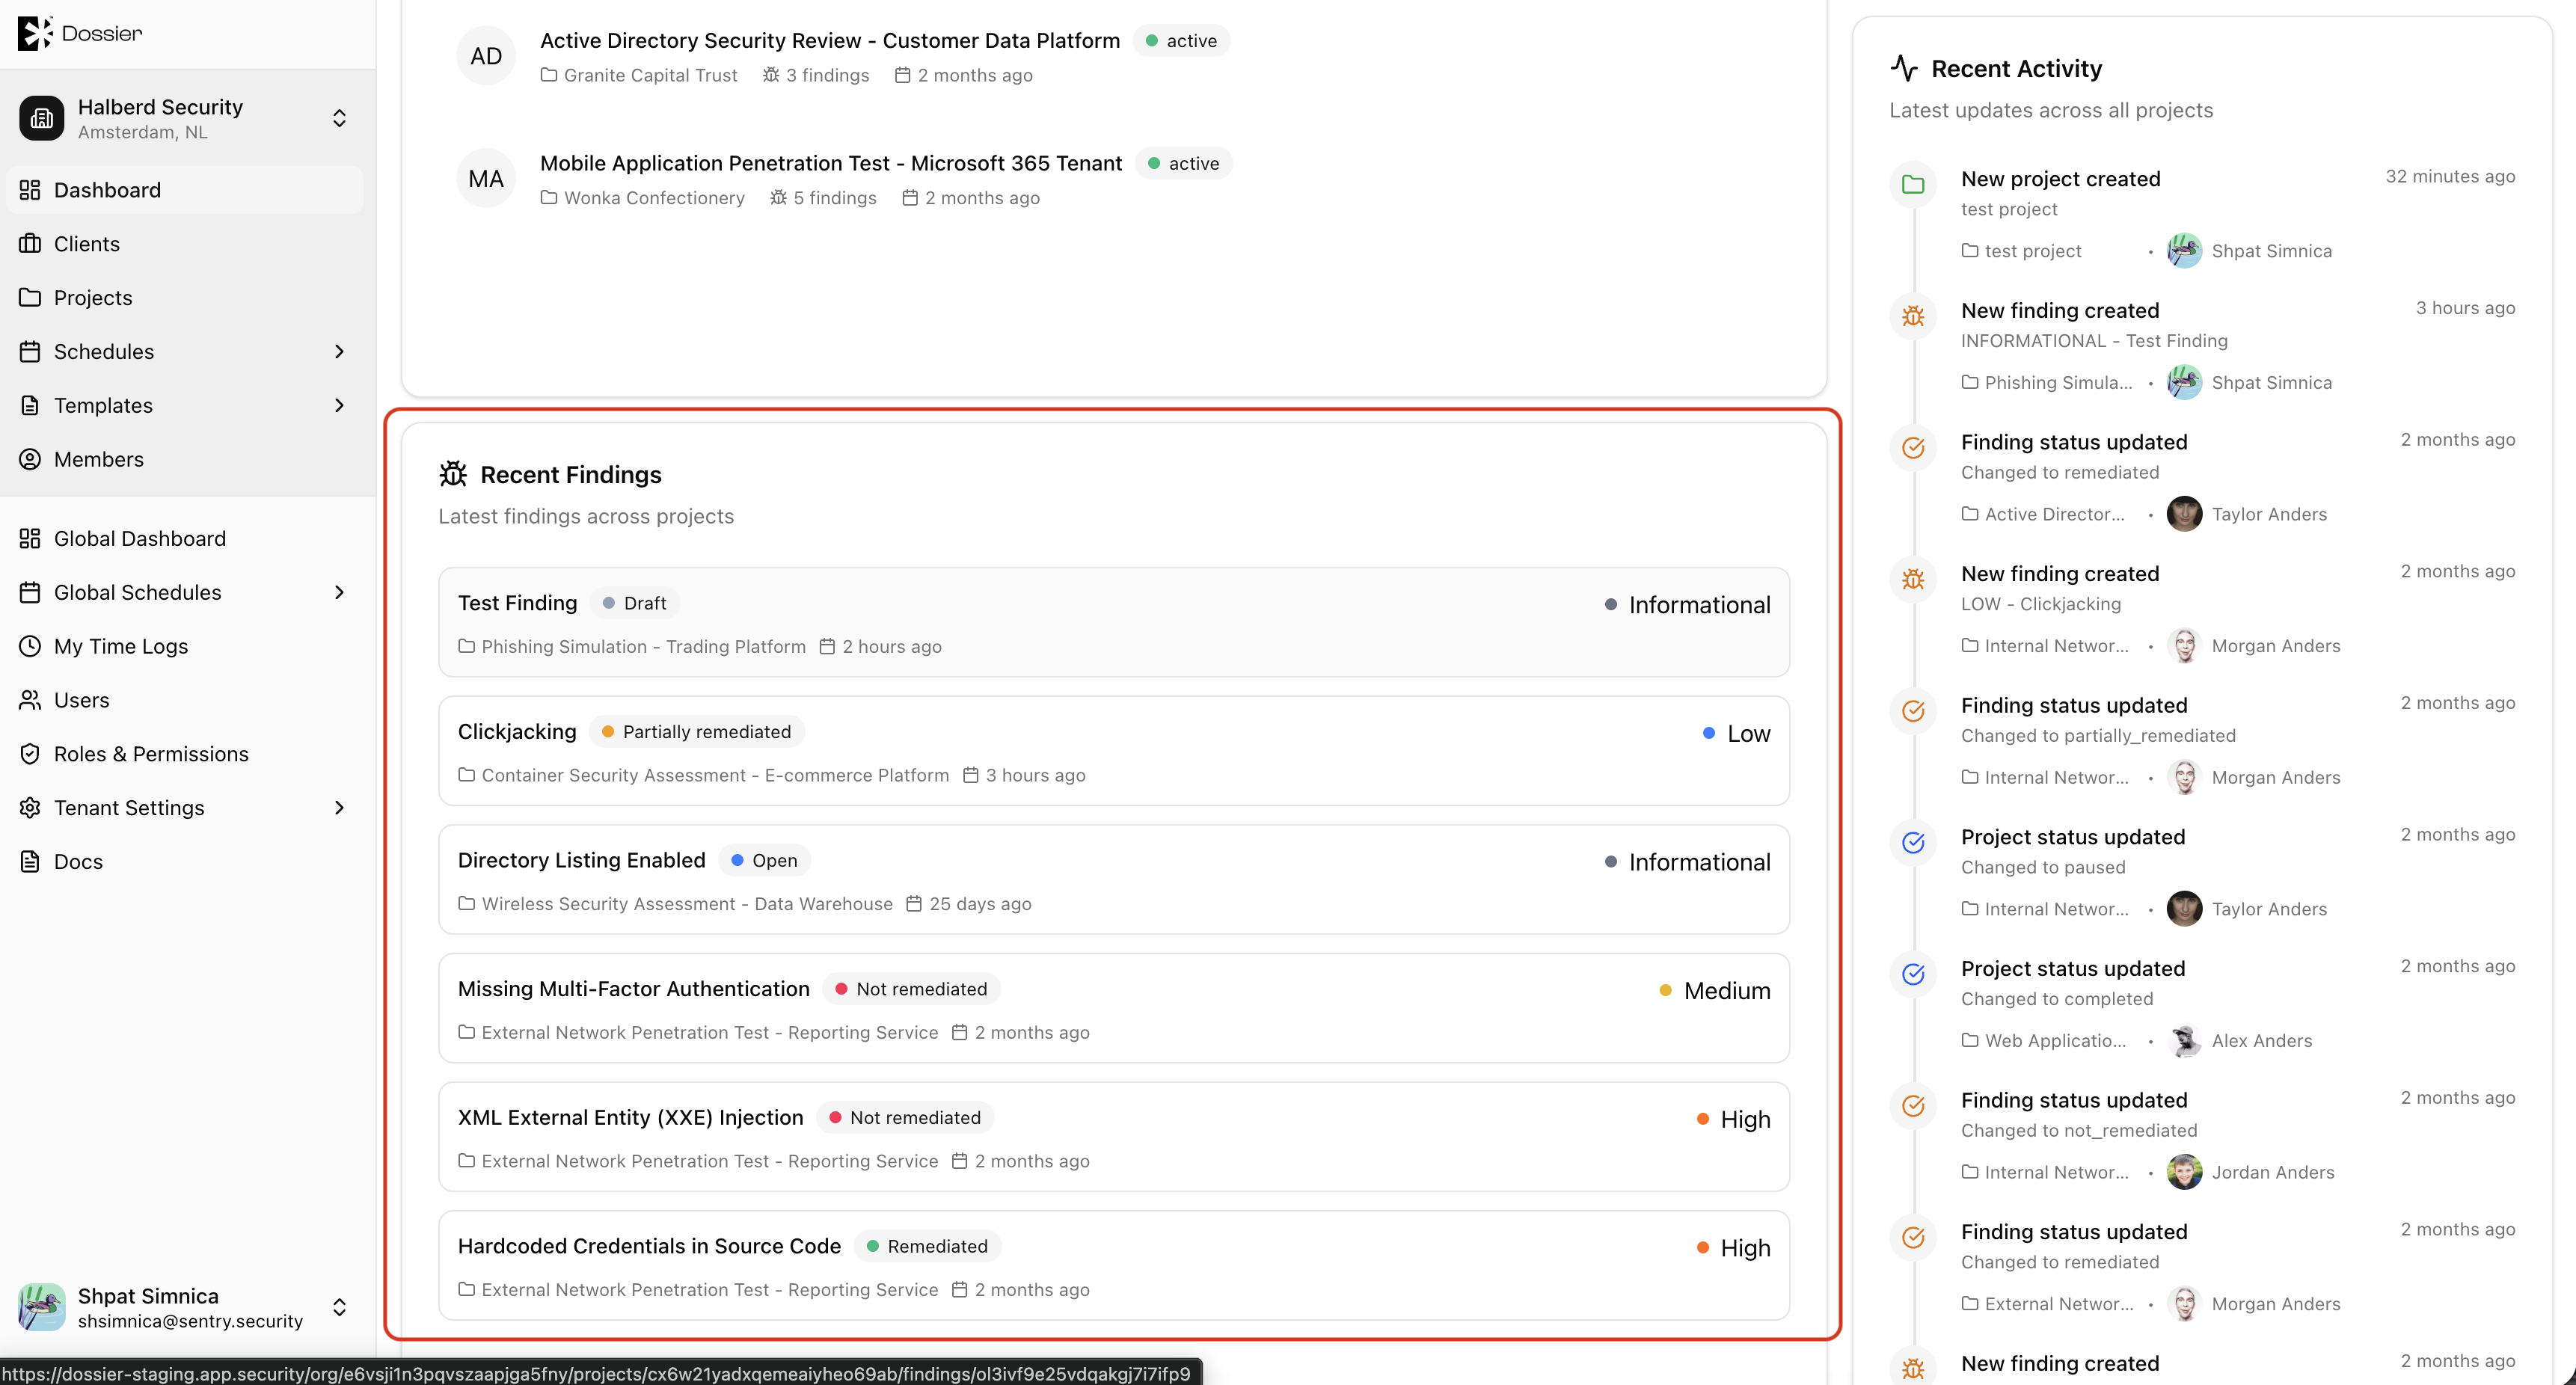
Below the charts, two lists show the most recently updated projects and findings. Click any row to navigate directly to that item.
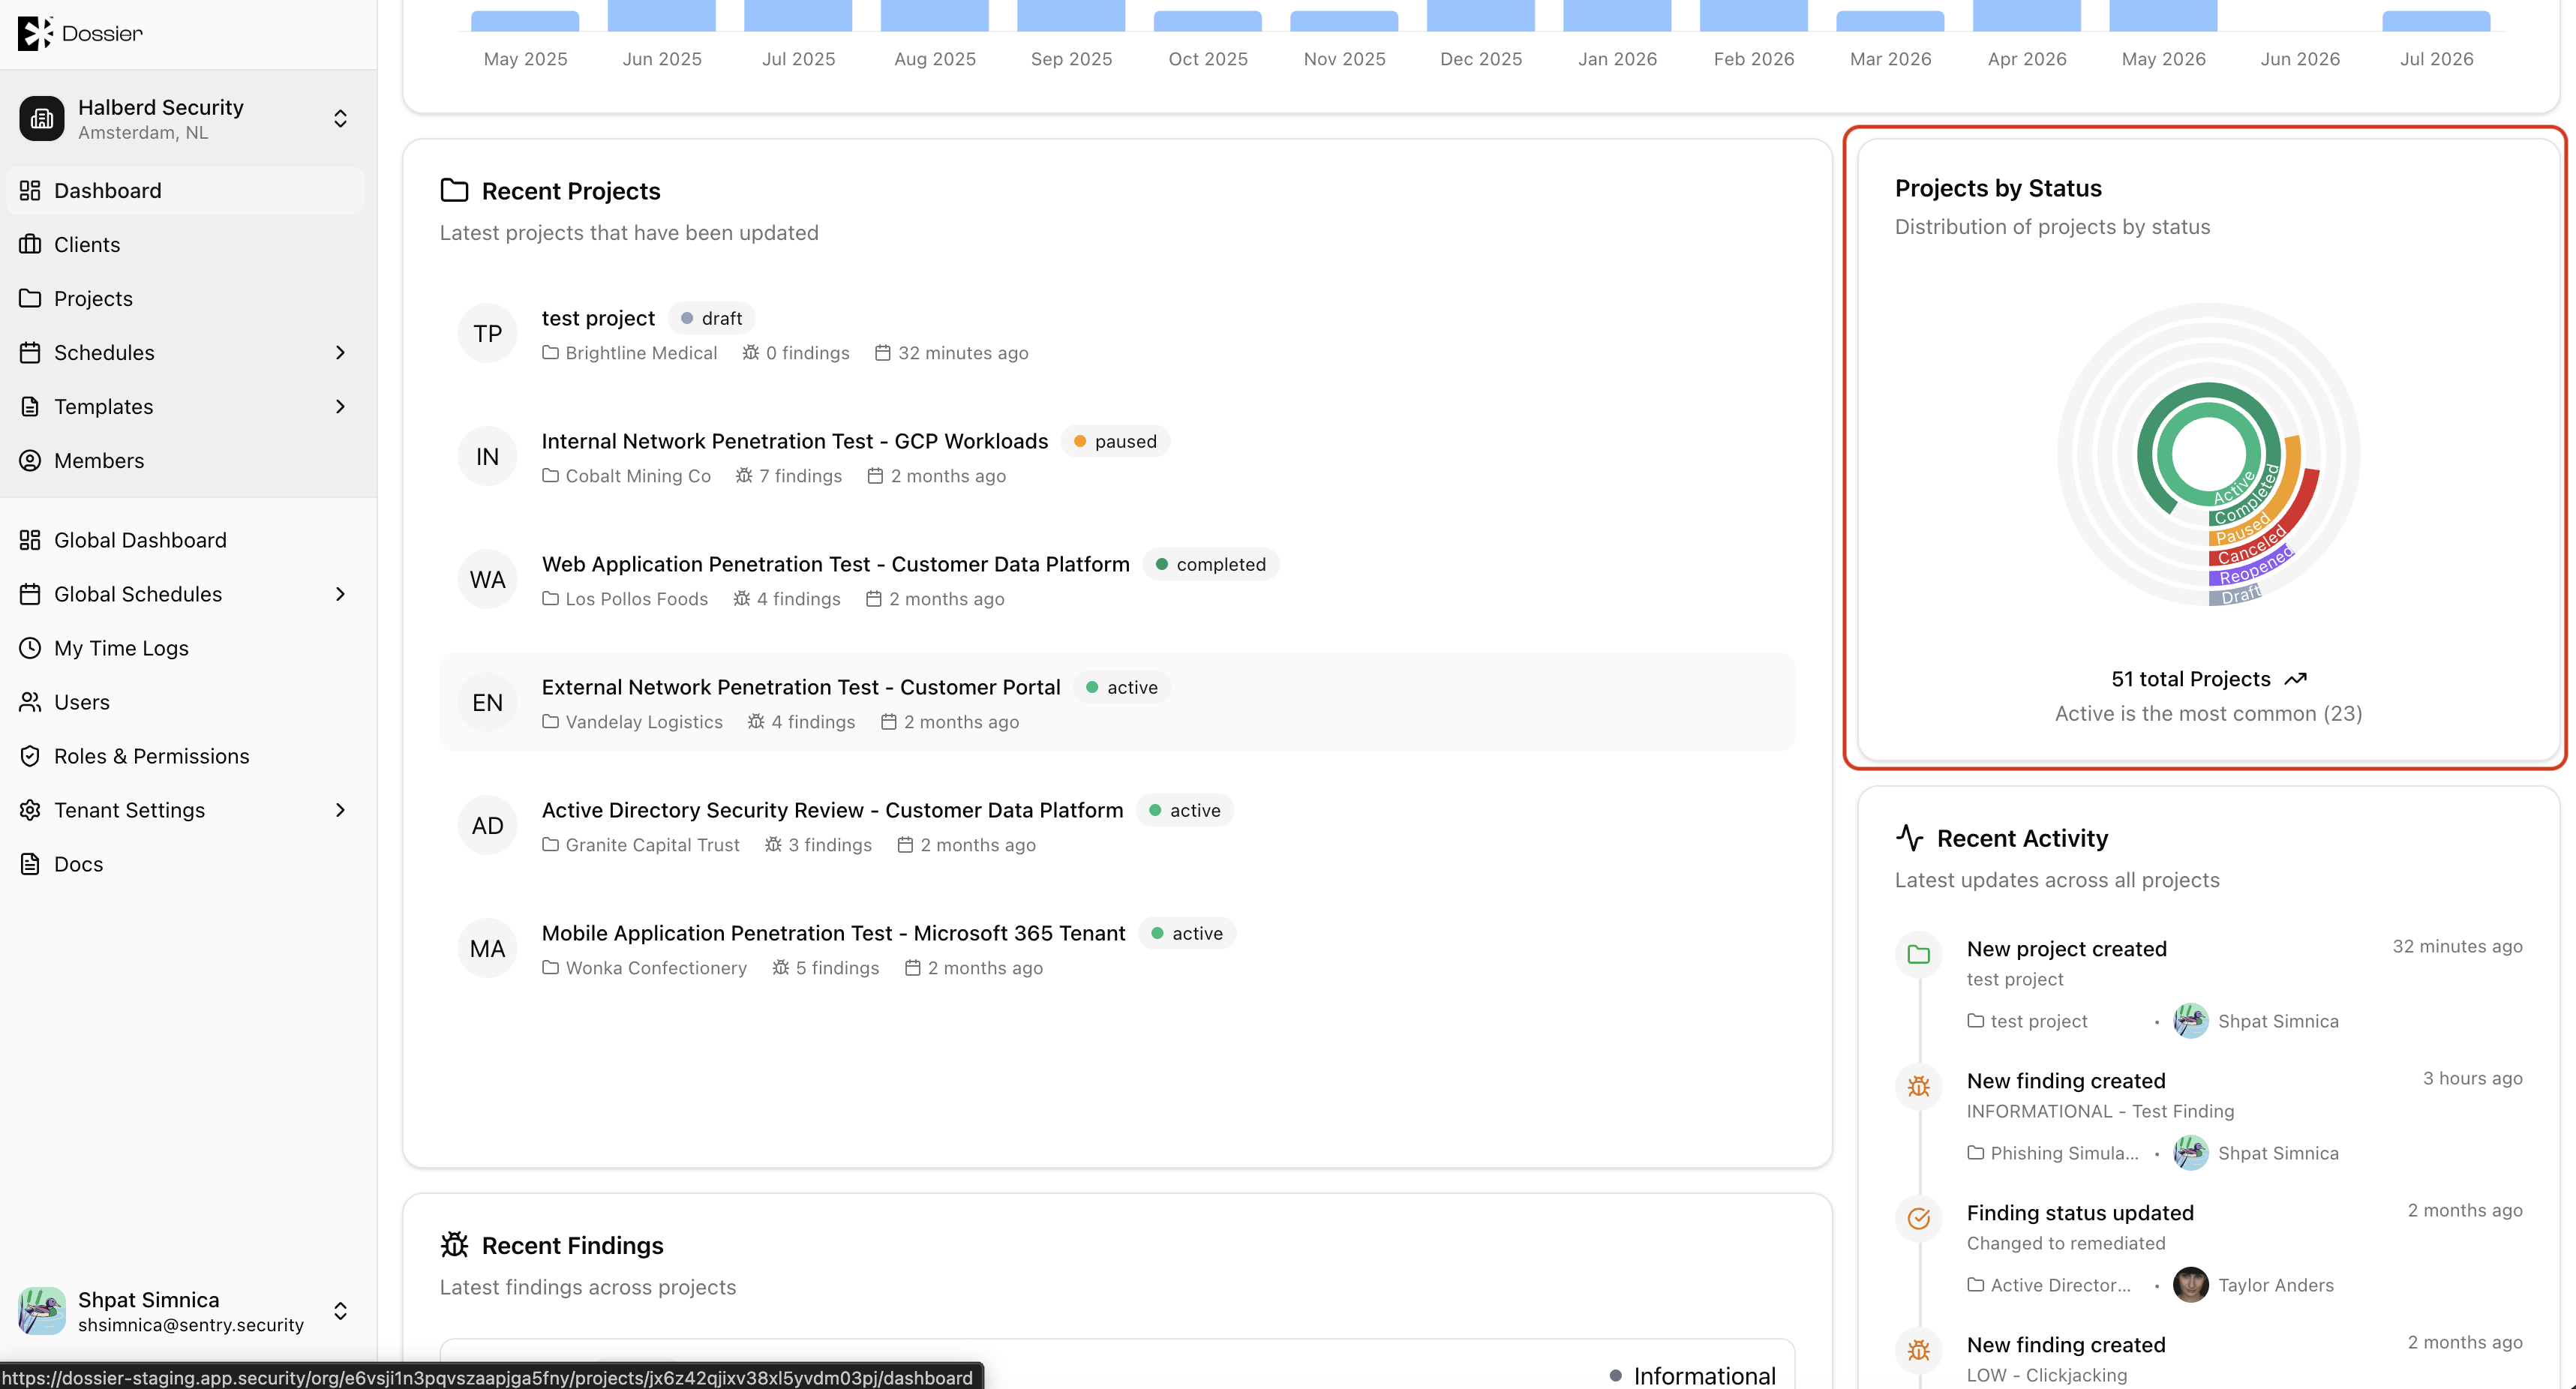
Projects by Status
The radial chart on the dashboard shows how projects are distributed across statuses: Draft, Planned, Active, Paused, Completed, and Canceled.